MANE 6313
Week 13, Module B
Student Learning Outcome
- Select an appropriate experimental design with one or more factors,
- Select an appropriate model with one or more factors,
- Evaluate statistical analyses of experimental designs,
- Assess the model adequacy of any experimental design, and
- Interpret model results.
Module Learning Outcome
Introduce graphical analysis in rsm.
Types of Graphs used in RSM
-
Contour plot
-
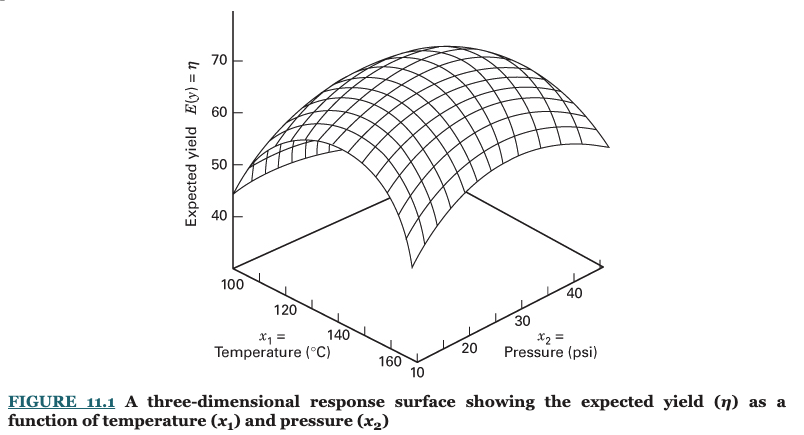
3D plot
3D Plot
Contourplot
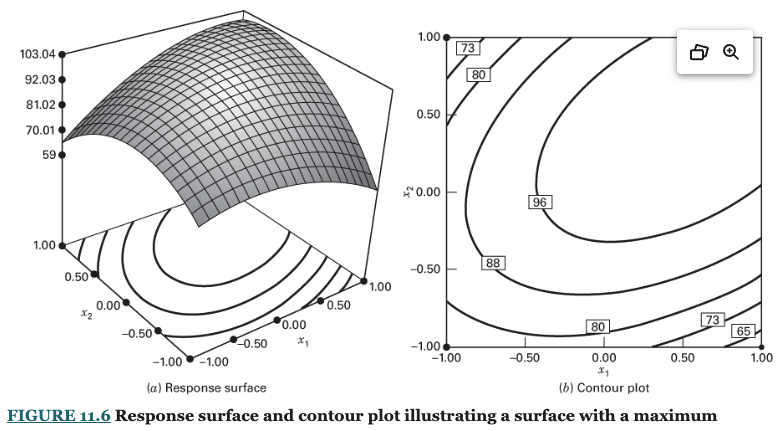
Function with a Maximum
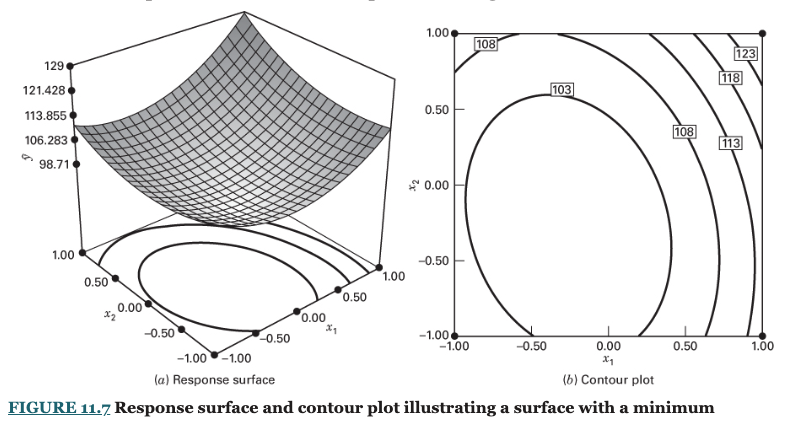
Function with a Minimum
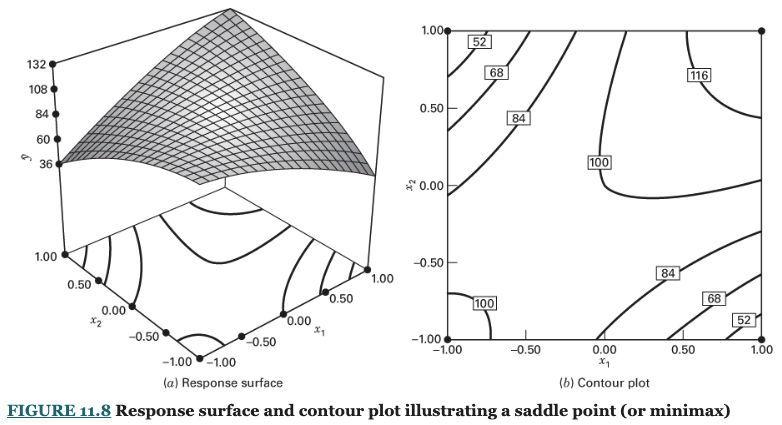
Function with a Saddle Point