MANE 6313
Week 2, Module E - Univariate Data Creation and Analysis
Module E will focus on univariate data creation and analysis. An excellent resource for the data analysis portion of this module is the Stats and R Blog.
Data Creation
- R stores a single variable in a vector
- There are two primary ways to create univariate data in R:
- c() function
- functions that create data such as rnorm
- Use example datasets in R (not covered)
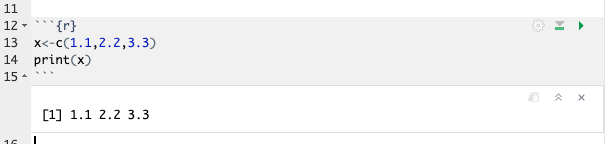
c() Function
- Most common way to create univariate data
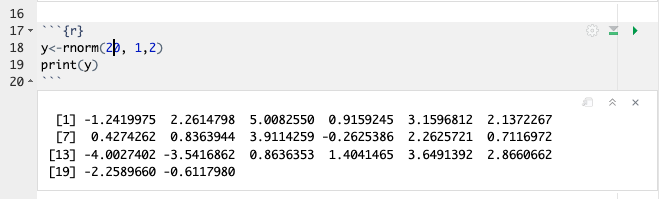
rnorm Function
- Built-in function to generate n random normal observations with mean value of mean and standard deviation of sd
- Mean and sd are optional arguments and default to values of 0 and 1 respectively
- rnorm(n,mean,sd)
Descriptive Statistics
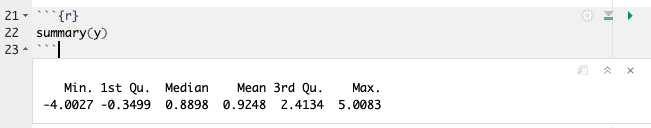
- Descriptive statistics refer to the values of numerical functions applied to data. Examples of descriptive statistics include mean, median, mode, standard deviation, variance, range, IQR, etc.
- Descriptive statistics in R include:
- summary()
- describe()
Summary Function
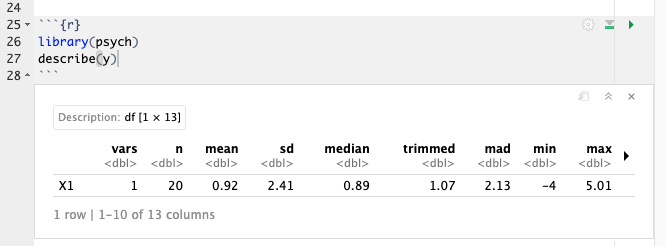
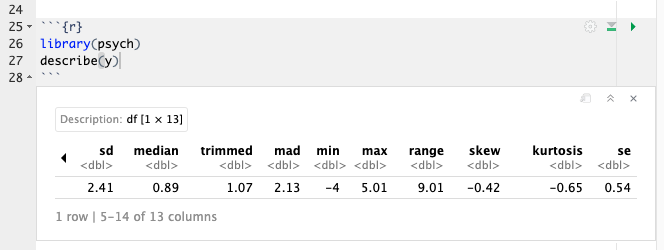
Describe
- Adds more statistics to report
- Requires the package psych to be installed
- Additional information can be found here
Graphical Analysis
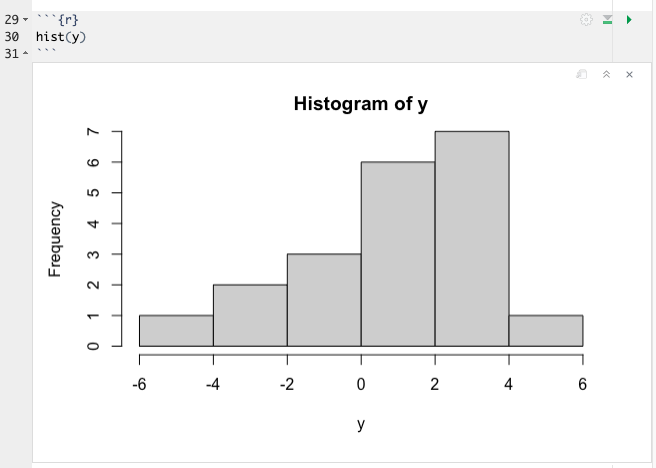
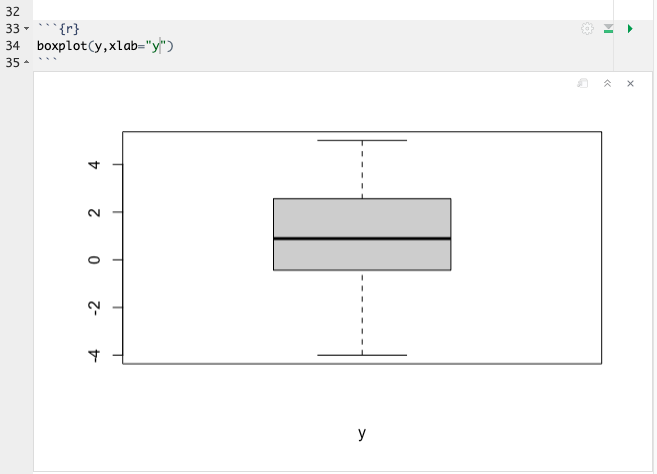
- Histogram, Boxplot, Stem and Leaf, Line plot, QQ-plot, QQ-plot with bands
Histogram
Boxplot
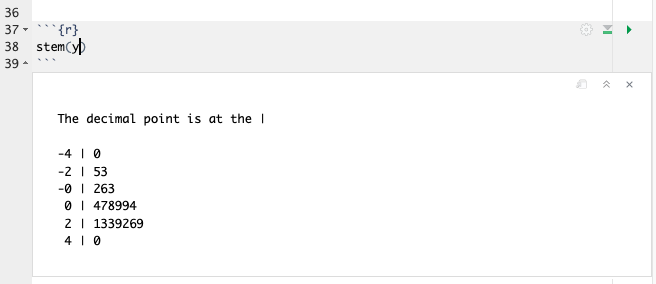
Stem-and-Leaf Diagram
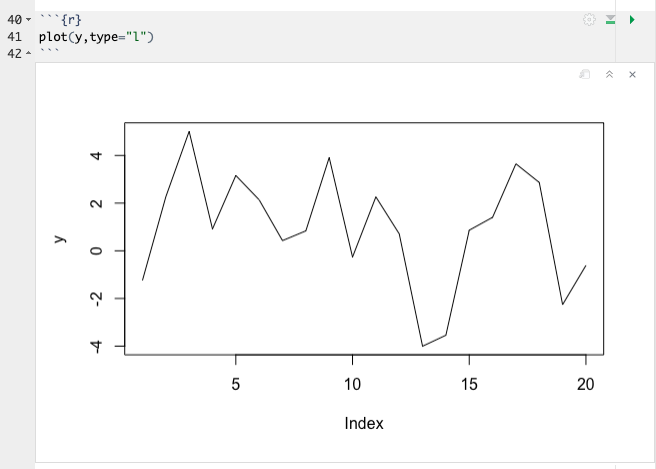
Line Plot
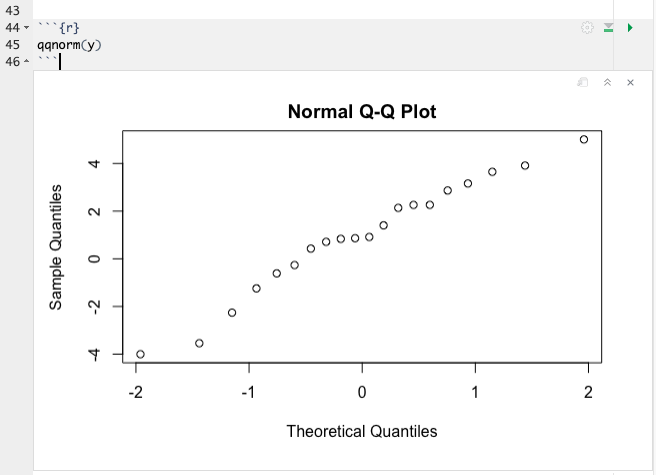
QQ-Plot
- Simple Normal Probability Plot
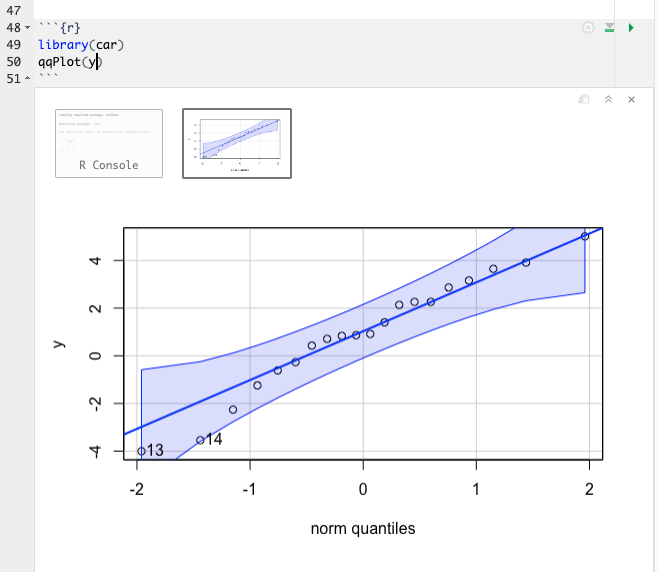
QQ-Plot with Probability Bands
- Requires package car to be installed