MANE 6313
Week 13, Module F
Student Learning Outcome
- Select an appropriate experimental design with one or more factors,
- Select an appropriate model with one or more factors,
- Evaluate statistical analyses of experimental designs,
- Assess the model adequacy of any experimental design, and
- Interpret model results.
Module Learning Outcome
Interpret contour and 3D plots in R
Graphical Analysis in R
- R provides contour plots and 3D (perspective) plots
- The second Box-Benkhen model from Module E will be used in this module
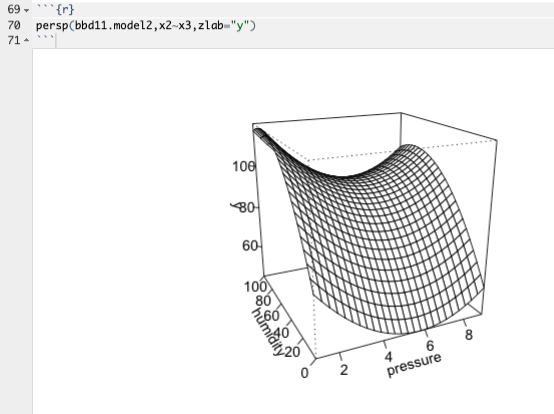
3D Plot
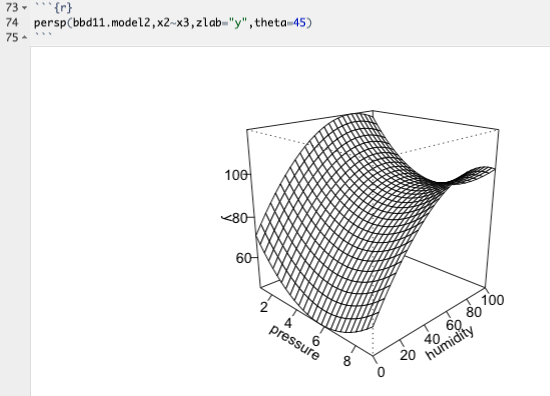
3D Plot with Theta=45, Phi=0
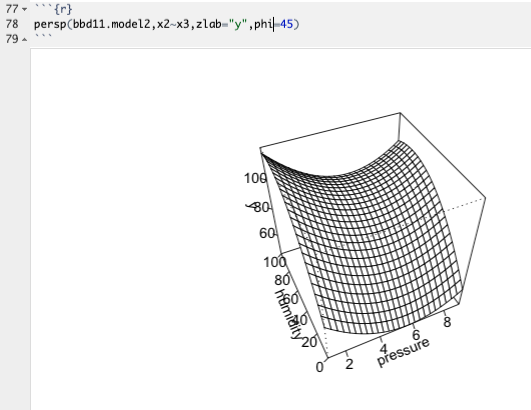
3D Plot with Theta=0,Phi=45
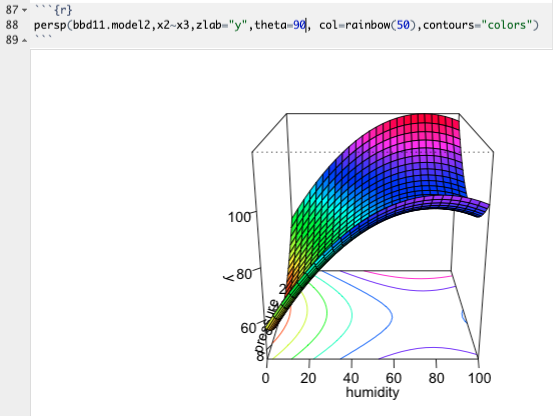
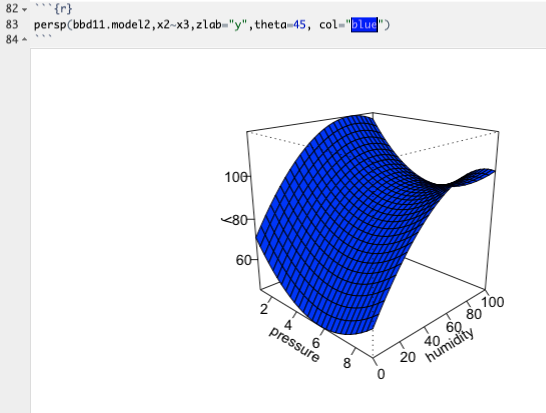
3D Plot with Color
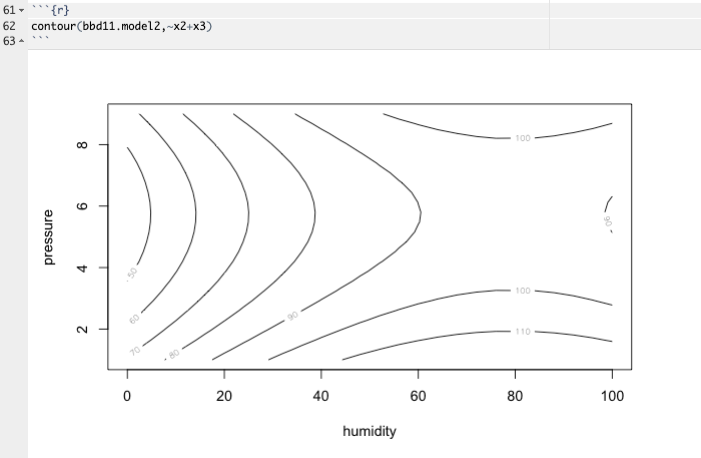
Non-image Contour Plot
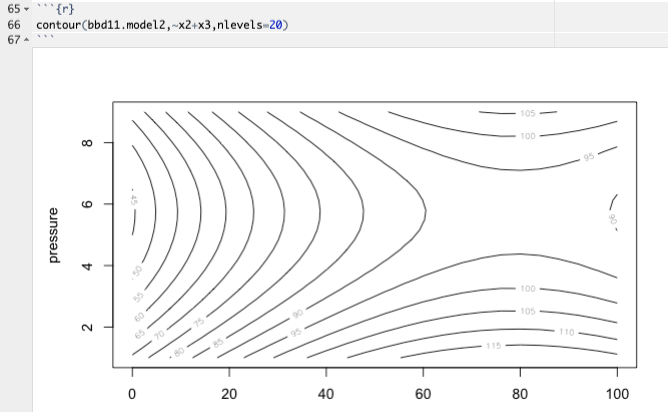
Contour Plot with More Lines
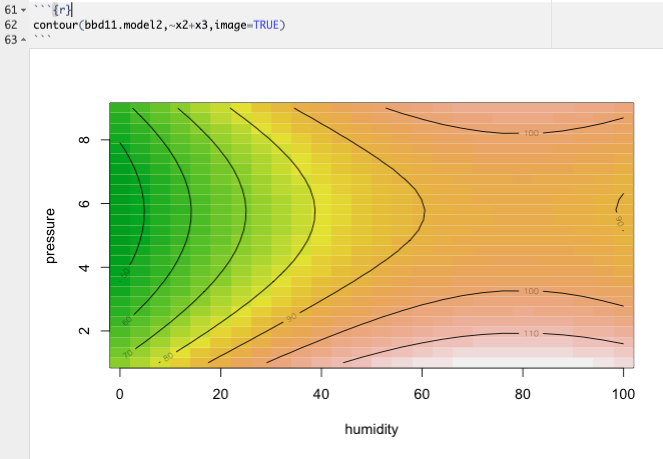
Contour Plot as Image
3D Plot with Contours